前言
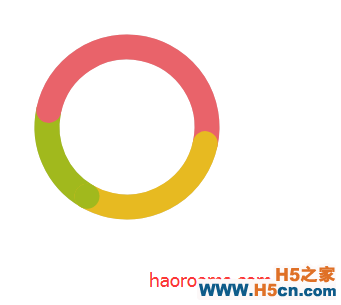
之前一篇文章,写过关于canvas绘制百分比的环形图,以及进度条模糊的解决方案,今天项目中用到了圆角环形图,查了一下百度echart,发现并没有圆角环形图,highchart的圆角环形图和项目中的有些出入,highchart的展示地址请看:https://www.hcharts.cn/demo/highcharts/gauge-activity 因此,用canvas写了一个,在这里分享一下。
示例图片
源代码很简单,欢迎大家扩展!
function Circle(radius, lineWidth, strokeStyle, fillStyleArray, capType) { this.radius = radius; // 圆环半径 this.lineWidth = lineWidth; // 圆环边的宽度 this.strokeStyle = strokeStyle; //边的颜色 this.fillStyle = fillStyleArray; //填充色 this.lineCap = capType; } Circle.prototype.draw = function (ctx,criclex,cricley) { ctx.beginPath(); ctx.arc(criclex, cricley, this.radius, 0, Math.PI * 2, true); // 坐标为90的圆,这里起始角度是0,结束角度是Math.PI*2 ctx.lineWidth = this.lineWidth; ctx.strokeStyle = this.strokeStyle; ctx.stroke(); // 这里用stroke画一个空心圆,想填充颜色的童鞋可以用fill方法 }; function Ring(radius, lineWidth, strokeStyle, fillStyleArray, capType) { Circle.call(this, radius, lineWidth, strokeStyle, fillStyleArray, capType); } Ring.prototype = Object.create(Circle.prototype); Ring.prototype.drawRing = function (ctx, startAngle, percentArray ,criclex,cricley) { startAngle = startAngle || 3 * Math.PI / 2; percentArray = percentArray || []; this.draw(ctx,criclex,cricley); // 调用Circle的draw方法画圈圈 var _this = this; // angle percentArray.forEach(function (item, index) { ctx.beginPath(); var anglePerSec = 2 * Math.PI / (100 / item); // 蓝色的弧度 ctx.arc(criclex, cricley, _this.radius, startAngle, startAngle + anglePerSec, false); //这里的圆心坐标要和cirle的保持一致 startAngle = startAngle + anglePerSec; ctx.strokeStyle = _this.fillStyle[index]; ctx.lineCap = _this.lineCap; ctx.stroke(); ctx.closePath(); }) //小圆圈覆盖 ctx.beginPath(); ctx.arc(criclex, cricley, _this.radius, startAngle, startAngle, false); //这里的圆心坐标要和cirle的保持一致 ctx.strokeStyle = _this.fillStyle[0]; ctx.lineCap = _this.lineCap; ctx.stroke(); ctx.closePath(); } demo案例案例预览请看前端资源库
github地址:https://github.com/confidence68/cricleRoundring
 相关文章
相关文章
 精彩导读
精彩导读 热门资讯
热门资讯 关注我们
关注我们
