pie_plotЦчТЄКЗУГАґ»±эНјµДАаЎЈ
arrow_styleЈє јэН·µДАаРН.
ёь¶аµДјэН·АаРНїЙТФІОїјЈє
#module-arrow
center:±эЦРРДµДО»ЦГ
data:КэѕЭФґ
data_colЈє КэѕЭАґЧФКэѕЭФґµДµЪјёБР
label_colЈє±кЗ©АґЧФКэѕЭФґµДµЪјёБР
start_angle:µЪТ»ПоїЄКј»µДК±єтµДЅЗ¶И
arc_offsetsЈєТ»°гОЄТ»ёцєНdataі¤¶ИПаµИµДКэѕЭЈ¬·Ц±р±нКѕГїТ»По»НјѕаАлЦРРДµДО»ЦГЎЈИз№ы¶јОЄ0Ј¬ФтГїТ»їйЦ®јдГ»УРїХП
shadowЈє±нКѕТхУ°Ј¬Из№ыЙиЦГБЛФтФЪ¶ФПуµДПВ·ЅЙиЦГЈ¬Ж«ТЖО»ЦГОЄX-off, and y-off
4 ѕШРОНјЈє
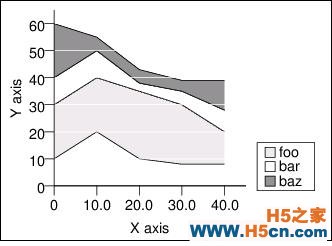
from pychart import *
data = [ (0, 10, 30, 40, 60), (10, 20, 40, 50, 55), (20, 10, 35, 38, 43),
(30, 8, 30, 35, 39), (40, 8, 20, 28, 39) ]
ar = area.T(x_axis = axis.X(label="X axis"),
y_grid_interval = 10, y_grid_style = line_style.white,
y_axis = axis.Y(label="Y axis"),
y_grid_over_plot=1, legend = legend.T())
if theme.use_color:
colors = [ fill_style.darkseagreen, fill_style.white, fill_style.brown ]
else:
colors = [ fill_style.gray90, fill_style.white, fill_style.gray50 ]
ar.add_plot(range_plot.T(label="foo", data=data, fill_style = colors[0]))
ar.add_plot(range_plot.T(label="bar", data=data, min_col=2, max_col=3,
fill_style = colors[1]))
ar.add_plot(range_plot.T(label="baz", data=data, min_col=3, max_col=4,
fill_style = colors[2]))
ar.draw()
range_plot єЬ¶аІОКэУлЖдЛыµДАаПа似Ј¬ЦчТЄУРБЅёц±ИЅПЦШТЄµДЎЈ
max_colЈєЙЁГиµДК±єтЅПёЯµД±ЯЅзЈ¬Д¬ИПОЄ2ЎЈ¶ФУ¦µД¶јКЗyЦбµД值
min_colЈєЙЁГиµДК±єтµНµД±ЯЅзЈ¬Д¬ИПОЄ1Ј¬¶ФУ¦µД¶јКЗyЦбµД值
xcolЈєxЦбµДКэѕЭАґФґ
ёЅЈє LabelКЅСщ
Restrictions: /h, /v, and /a must appear in the beginning of a string.
/add
Specifies the angle of the text. Parameter dd is a number between -360 to 360. Value 0 means left-to-right text, 90 means bottom-to-up, etc. If you want to print numbers right after an angle specification, put { between the angle and the number. For example,
the below code shows string ""100"" at a 60-degree angle.
"/a60{}100"
/hA:
Specifies horizontal alignment of the text. A is one of "L" (left alignment), "R" (right alignment), or "C" (center alignment).
/vA:
Specifies vertical alignment of the text. A is one of "B" (bottom), "T" (top), or "M" (middle).
/T
: Switch to Times font family.
/H:
Switch to Helvetica font family.
/C:
Switch to Courier font family.
/B:
Switch to Bookman-Demi font family.
/A:
Switch to AvantGarde-Book font family.
/P:
Switch to Palatino font family.
/S:
Switch to Symbol font family.
/F{family}:
Switch to family font family. The below example draws string "Funny" using ZapfDingbat font (which produces some meaningless output).
canvas.show(100, 200, "/F{ZapfDingbat}Funny")
The list of available fonts are the following:
Bookman-Demi Bookman-Light Courier AvantGarde-Book AvantGarde-Demi Helvetica Helvetica-Narrow Palatino NewCenturySchlbk Times Symbol ZapfChancery-MediumItalic ZapfChancery-Medium-Italic ZapfDingbats
/b:Switch to bold typeface.
/i:Switch to italic typeface.
/o:Switch to oblique typeface.
/dd: Set font size to dd points.
"/20{}2001 space odyssey!"
/cdd:
Set gray-scale to 0.dd. Gray-scale of 0 means black, 1 means white.
//, /{, /}:
Display `/', `}', or `{'.
{ ... }:
Limit the scope of escape sequences. For example, "{/10{/20Big text} and small text}" will display "Big Text" using a 20-point font, and "and small text" using a 10-point font.
$\backslash$n:
ЎЎ
 Па№ШОДХВ


 ѕ«ІКµј¶Б
 ИИГЕЧКС
 №ШЧўОТГЗ
