Fractals show the beauty of numbers. There are many famous fractals, which are often named after European mathematicians. You may have heard of Sierpinski's Triangle, the Mandelbrot Set, and the Koch Curve. These are all fractal patterns.
I'm going to show you how to create the Koch Snowflake using the Canvas element.
The Koch Snowflake is not technically a fractal. It is a shape made up of three Koch Curves. When these Koch Curves are positioned correctly they create a Koch Snowflake.
Let's create the function that draws a Koch Curve. We'll name it koch.
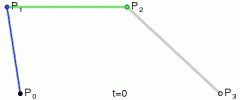
const koch = (a, b, limit = 3) => { let [dx, dy] = [b.x - a.x, b.y - a.y] let dist = Math.sqrt(dx * dx + dy * dy) let unit = dist / 3 let angle = Math.atan2(dy, dx) //This will be the triangular shape that makes the 'points' on the snowflake let p1 = { x: a.x + dx / 3, y: a.y + dy / 3 } let p3 = { x: b.x - dx / 3, y: b.y - dy / 3 } let p2 = { x: p1.x + Math.cos(angle - Math.PI / 3) * unit, y: p1.y + Math.sin(angle - Math.PI / 3) * unit } if (limit > 0) { // Decrease limit each time it's called koch(a, p1, limit - 1) koch(p1, p2, limit - 1) koch(p2, p3, limit - 1) koch(p3, b, limit - 1) } else { context.beginPath() context.moveTo(a.x, a.y) context.lineTo(p1.x, p1.y) context.lineTo(p2.x, p2.y) context.lineTo(p3.x, p3.y) context.lineTo(b.x, b.y) context.stroke() } }The Koch function above takes two starting coordinates. These should be in the form of {x: 90, y: 90} . We'll use these coordinates to plot where the triangular 'curve' should be placed. You can see the coordinates for the triangle's points defined as p1,p2,p3 inside the function.
The function will be called recursively, to create the fractal. We must ensure that an infinite loop is not formed. To prevent this we pass in a default limit of recursion. This can be changed. Changing it to a higher number, will add little visual difference.
To use this function and create the Koch Snowflake, we must add some more boilerplate code.
(() => { // Create canvas element, that we will draw on const canvas = document.createElement('canvas') document.body.appendChild(canvas) const context = canvas.getContext('2d') const width = canvas.width = 420 const height = canvas.height = 420 // The starting cordinates, basically tilting the Koch Curve // so that when we add three together they form the snowflake const startingPoints = { p1: { x: 0, y: -150 }, p2: { x: 150, y: 100 }, p3: { x: -150, y: 100 } } // Draw relative to center of the screen context.translate(.5 * width, .5 * height) // add a default limit of three as we don't want an infinite loop const koch = (a, b, limit = 3) => { let [dx, dy] = [b.x - a.x, b.y - a.y] let dist = Math.sqrt(dx * dx + dy * dy) let unit = dist / 3 let angle = Math.atan2(dy, dx) //This will be the triangular shape that makes the 'point' of the curve let p1 = { x: a.x + dx / 3, y: a.y + dy / 3 } let p3 = { x: b.x - dx / 3, y: b.y - dy / 3 } let p2 = { x: p1.x + Math.cos(angle - Math.PI / 3) * unit, y: p1.y + Math.sin(angle - Math.PI / 3) * unit } if (limit > 0) { // Decrease limit each time it's called koch(a, p1, limit - 1) koch(p1, p2, limit - 1) koch(p2, p3, limit - 1) koch(p3, b, limit - 1) } else { context.beginPath() context.moveTo(a.x, a.y) context.lineTo(p1.x, p1.y) context.lineTo(p2.x, p2.y) context.lineTo(p3.x, p3.y) context.lineTo(b.x, b.y) context.stroke() } } // draw the shape using our predefined co-ordinates koch(startingPoints.p1, startingPoints.p2) koch(startingPoints.p2, startingPoints.p3) koch(startingPoints.p3, startingPoints.p1) })()If you have followed these examples correctly you should have something that looks like the following codepen .
SummaryIt's true. I left out a lot of detail here. Fractals are both simple and complex, which makes them hard to explain. I can show you quite easily how to make a fractal, but explaining why certain numbers and methods work is much harder. I have been playing around with canvas fractals for a while and I am only just starting to get a feel for it.
If you are intrigued and want to learn more, I recommend looking at the mathematics behind fractals, as opposed to how to code them. The prior will lead to the latter.
I recommend checking out Numberphile on YoutTube. This channel does an awesome job of explaining complex maths. It's also a great source of inspiration for writing code.
Want a challenge? Using the methods I introduced above, try creating the Sierpinski Triangle . If you manage to do it post the result as a comment.
Originally posted on hard-coded.com
本文前端(javascript)相关术语:javascript是什么意思 javascript下载 javascript权威指南 javascript基础教程 javascript 正则表达式 javascript设计模式 javascript高级程序设计 精通javascript javascript教程
分页:12
转载请注明
本文标题:Creating Fractals
本站链接:
分享请点击:
1.凡CodeSecTeam转载的文章,均出自其它媒体或其他官网介绍,目的在于传递更多的信息,并不代表本站赞同其观点和其真实性负责;
2.转载的文章仅代表原创作者观点,与本站无关。其原创性以及文中陈述文字和内容未经本站证实,本站对该文以及其中全部或者部分内容、文字的真实性、完整性、及时性,不作出任何保证或承若;
3.如本站转载稿涉及版权等问题,请作者及时联系本站,我们会及时处理。
登录后可拥有收藏文章、关注作者等权限...
注册 登录
 相关文章
相关文章
 精彩导读
精彩导读 热门资讯
热门资讯 关注我们
关注我们
