matplotlib还提供了一个名为pylab的模块,其中包括了许多NumPy和pyplot模块中常用的函数,方便用户快速进行计算和绘图,十分适合在IPython交互式环境中使用。这里使用下面的方式载入pylab模块:
>>> import pylab as pl1 安装numpy和matplotlib
>>> import numpy
>>> numpy.__version__
>>> import matplotlib
>>> matplotlib.__version__
2 两种常用图类型:Line and scatter plots(使用plot()命令), histogram(使用hist()命令)
2.1 折线图&散点图 Line and scatter plots
2.1.1 折线图 Line plots(关联一组x和y值的直线)
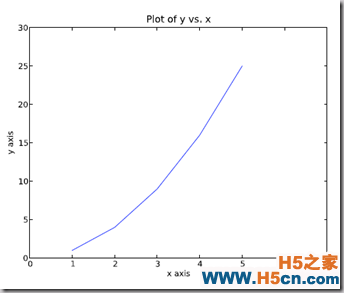
import numpy as np import pylab as pl x = [1, 2, 3, 4, 5]# Make an array of x values y = [1, 4, 9, 16, 25]# Make an array of y values for each x value pl.plot(x, y)# use pylab to plot x and y pl.show()# show the plot on the screen
2.1.2 散点图 Scatter plots
把pl.plot(x, y)改成pl.plot(x, y, 'o')即可,下图的蓝色版本
2.2 美化 Making things look pretty
2.2.1 线条颜色 Changing the line color
红色:把pl.plot(x, y, 'o')改成pl.plot(x, y, ’or’)


2.2.2 线条样式 Changing the line style
虚线:plot(x,y, '--')

2.2.3 marker样式 Changing the marker style
蓝色星型markers:plot(x,y, ’b*’)

2.2.4 图和轴标题以及轴坐标限度 Plot and axis titles and limits
import numpy as np import pylab as pl x = [1, 2, 3, 4, 5]# Make an array of x values y = [1, 4, 9, 16, 25]# Make an array of y values for each x value pl.plot(x, y)# use pylab to plot x and y pl.title(’Plot of y vs. x’)# give plot a title pl.xlabel(’x axis’)# make axis labels pl.ylabel(’y axis’) pl.xlim(0.0, 7.0)# set axis limits pl.ylim(0.0, 30.) pl.show()# show the plot on the screen
2.2.5 在一个坐标系上绘制多个图 Plotting more than one plot on the same set of axes
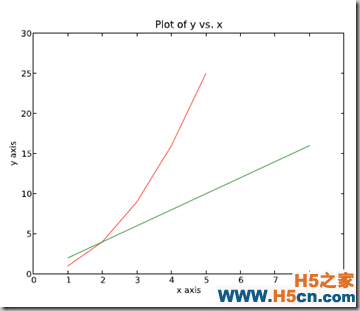
做法是很直接的,依次作图即可:
import numpy as np import pylab as pl x1 = [1, 2, 3, 4, 5]# Make x, y arrays for each graph y1 = [1, 4, 9, 16, 25] x2 = [1, 2, 4, 6, 8] y2 = [2, 4, 8, 12, 16] pl.plot(x1, y1, ’r’)# use pylab to plot x and y pl.plot(x2, y2, ’g’) pl.title(’Plot of y vs. x’)# give plot a title pl.xlabel(’x axis’)# make axis labels pl.ylabel(’y axis’) pl.xlim(0.0, 9.0)# set axis limits pl.ylim(0.0, 30.) pl.show()# show the plot on the screen
2.2.6 图例 Figure legends
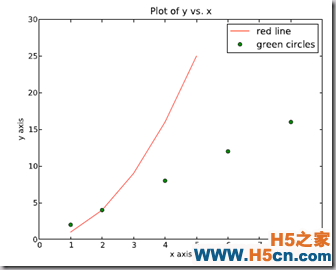
pl.legend((plot1, plot2), (’label1, label2’), 'best’, numpoints=1)
其中第三个参数表示图例放置的位置:'best’‘upper right’, ‘upper left’, ‘center’, ‘lower left’, ‘lower right’.
如果在当前figure里plot的时候已经指定了label,如plt.plot(x,z,label="$cos(x^2)$"),直接调用plt.legend()就可以了哦。
import numpy as np import pylab as pl x1 = [1, 2, 3, 4, 5]# Make x, y arrays for each graph y1 = [1, 4, 9, 16, 25] x2 = [1, 2, 4, 6, 8] y2 = [2, 4, 8, 12, 16] plot1 = pl.plot(x1, y1, ’r’)# use pylab to plot x and y : Give your plots names plot2 = pl.plot(x2, y2, ’go’) pl.title(’Plot of y vs. x’)# give plot a title pl.xlabel(’x axis’)# make axis labels pl.ylabel(’y axis’) pl.xlim(0.0, 9.0)# set axis limits pl.ylim(0.0, 30.) pl.legend([plot1, plot2], (’red line’, ’green circles’), ’best’, numpoints=1)# make legend pl.show()# show the plot on the screen
 相关文章
相关文章
 精彩导读
精彩导读 热门资讯
热门资讯 关注我们
关注我们
